Chapter 9 Dplyr and vlookups
9.1 Summary
In previous sessions, we’ve learned to do some basic wrangling and find summary information with functions in the dplyr package, which exists within the tidyverse. We’ve used:
count(): get counts of observations for groupings we specifymutate(): add a new column, while keeping the existing onesgroup_by(): let R know that groups exist within the dataset, by variable(s)summarize(): calculate a value (that you specify) for each group, then report each group’s value in a table
In this session, we’ll expand our data wrangling toolkit using:
filter()to conditionally subset our data by rows, and*_join()functions to merge data frames together
The combination of filter() and *_join() - to return rows satisfying a condition we specify, and merging data frames by like variables - is analogous to the useful VLOOKUP function in Excel.
9.1.1 Objectives
- Use
filter()to subset data frames, returning rows that satisfy variable conditions - Use
full_join(),left_join(), andinner_join()to merge data frames, with different endpoints in mind - Use
filter()and*_join()as part of a wrangling sequence
9.2 Lessons
9.2.1 Getting started - Create a new .Rmd, attach packages & get data
Create a new R Markdown document in your r-workshop project and knit to save as filter_join.Rmd. Remove all the example code (everything below the set-up code chunk).
In this session, we’ll use three packages:
tidyversereadxlhere
Attach the packages in the setup code chunk in your .Rmd:
Then create a new code chunk to read in three files from your ‘data’ subfolder:
- invert_counts_curated.xlsx
- fish_counts_curated.csv
- kelp_counts_curated.xlsx
# Read in data:
invert_counts <- read_excel(here("data", "invert_counts_curated.xlsx"))
fish_counts <- read_csv(here("data", "fish_counts_curated.csv"))
kelp_counts_abur <- read_excel(here("data", "kelp_counts_curated.xlsx"))
We should always explore the data we’ve read in using functions like View(), names(), summary(), head() and tail() to ensure that the data we think we’ve read in is actually the data we’ve read in.
Now, let’s use filter() to decide which observations (rows) we’ll keep or exclude in new subsets, similar to using Excel’s VLOOKUP function.
9.2.2 filter() to conditionally subset by rows
Use filter() to let R know which rows you want to keep or exclude, based whether or not their contents match conditions that you set for one or more variables.

Some examples in words that might inspire you to use filter():
- “I only want to keep rows where the temperature is greater than 90°F.”
- “I want to keep all observations except those where the tree type is listed as unknown.”
- “I want to make a new subset with only data for mountain lions (the species variable) in California (the state variable).”
When we use filter(), we need to let R know a couple of things:
- What data frame we’re filtering from
- What condition(s) we want observations to match and/or not match in order to keep them in the new subset
Here, we’ll learn some common ways to use filter().
9.2.2.1 Filter rows by matching a single character string
Let’s say we want to keep all observations from the fish_counts data frame where the common name is “garibaldi.” Here, we need to tell R to only keep rows from the fish_counts data frame when the common name (common_name variable) exactly matches garibaldi.
Use == to ask R to look for matching strings:
Check out the fish_garibaldi object to ensure that only garibaldi observations remain.
You could also do this using the pipe operator %>%:
9.2.2.2 Activity
Task: Create a subset from the fish_counts data frame, stored as object fish_abur, that only contains observations from Arroyo Burro (site ‘abur’).
Solution:
Explore the subset you just created to ensure that only Arroyo Burro observations are returned.
9.2.2.3 Filter rows based on numeric conditions
Use expected operators (>, <, >=, <=, ==) to set conditions for a numeric variable when filtering. For this example, we only want to retain observations when the total_count column value is >= 50:
Or, using the pipe:
9.2.2.4 Filter to return rows that match this OR that OR that
What if we want to return a subset of the fish_counts df that contains garibaldi, blacksmith OR black surfperch?
There are several ways to write an “OR” statement for filtering, which will keep any observations that match Condition A or Condition B or Condition C. In this example, we will create a subset from fish_counts that only contains rows where the common_name is garibaldi or blacksmith or black surfperch.
Use %in% to ask R to look for any matches within a combined vector of strings:
fish_3sp <- fish_counts %>%
  filter(common_name %in% c("garibaldi", "blacksmith", "black surfperch"))
Alternatively, you can indicate OR using the vertical line operator | to do the same thing (but you can see that it’s more repetitive when looking for matches within the same variable):
9.2.2.5 Filter to return rows that match conditions for multiple variables
In the previous examples, we set filter conditions based on a single variable (e.g. common_name). What if we want to return observations that satisfy conditions for multiple variables?
For example: We want to create a subset that only returns rows from ‘invert_counts’ where the site is “abur” or “mohk” and the common_name is “purple urchin.” In filter(), add a comma (or ampersand, &) between arguments for multiple AND conditions:
urchin_abur_mohk <- invert_counts %>%
filter(site %in% c("abur","mohk"), common_name == "purple urchin")## # A tibble: 2 x 6
## month site common_name `2016` `2017` `2018`
## <chr> <chr> <chr> <dbl> <dbl> <dbl>
## 1 7 abur purple urchin 48 48 48
## 2 7 mohk purple urchin 620 505 323Like most things in R, there are other ways to do the same thing. For example, you could do the same thing using & (instead of a comma) between “and” conditions:
# Use the ampersand (&) to add another condition "and this must be true":

urchin_abur_mohk <- invert_counts %>%
  filter(site %in% c("abur","mohk") & common_name == "purple urchin")
Or you could just do two filter steps in sequence:
# Written as sequential filter steps:

urchin_abur_mohk <- invert_counts %>%
  filter(site %in% c("abur", "mohk")) %>%
  filter(common_name == "purple urchin")
9.2.2.5.1 Activity: combined filter conditions
Task: Create a subset from the fish_counts data frame, called low_gb_wr that only contains:
- Observations of garibaldi and rock wrasse
- Where the total_count is less than or equal to 10
Solution:
low_gb_wr <- fish_counts %>%
  filter(common_name %in% c("garibaldi", "rock wrasse"),
         total_count <= 10)
Sync your local project to your repo on GitHub.
9.2.2.6 Filter to return rows that do not match conditions
Sometimes we might want to exclude observations. Here, let’s say we want to make a subset that contains all rows from fish_counts except those recorded at the Mohawk Reef site (“mohk” in the site variable).
We use != to return observations that do not match a condition.
Like this:
This similarly works to exclude observations by a value.
For example, if we want to return all observations except those where the total fish count is 1, we use:
What if we want to exclude observations for multiple conditions? For example, here we want to return all rows where the fish species is not garibaldi or rock wrasse.
We can use filter(!variable %in% c("apple", "orange")) to return rows where the variable does not match “apple” or “orange”. For our fish example, that looks like this:
Which then only returns observations for the other fish species in the dataset.
## # A tibble: 6 x 4
##    year site  common_name     total_count
##   <dbl> <chr> <chr>                 <dbl>
## 1  2016 abur  black surfperch           2
## 2  2016 abur  blacksmith                1
## 3  2016 abur  senorita                 58
## 4  2016 aque  black surfperch           1
## 5  2016 aque  blacksmith                1
## 6  2016 aque  senorita                 57
9.2.2.7 Example: combining filter() with other functions using the pipe operator (%>%)
We can also use filter() in combination with the functions we previously learned for wrangling. If we have multiple sequential steps to perform, we can string them together using the pipe operator (%>%).
Here, we’ll start with the invert_counts data frame and create a subset that:
- Converts to long(er) format with
pivot_longer() - Only keeps observations for rock scallops
- Calculates the total count of rock scallops by site only
# Counts of scallops by site (all years included):
scallop_count_by_site <- invert_counts %>%
  pivot_longer(cols = '2016':'2018',
               names_to = "year",
               values_to = "sp_count") %>%
  filter(common_name == "rock scallop") %>%
  group_by(site) %>%
summarize(tot_count = sum(sp_count, na.rm = TRUE))## # A tibble: 11 x 2
## site tot_count
## <chr> <dbl>
## 1 abur 48
## 2 ahnd 48
## 3 aque 152
## 4 bull 48
## 5 carp 2519
## 6 golb 48
## 7 ivee 169
## 8 mohk 346
## 9 napl 6416
## 10 scdi 2390
## 11 sctw 12599.2.3 Merging data frames with *_join()
Excel’s VLOOKUP can also be used to merge data from separate tables or worksheets. Here, we’ll use the *_join() functions to merge separate data frames in R.
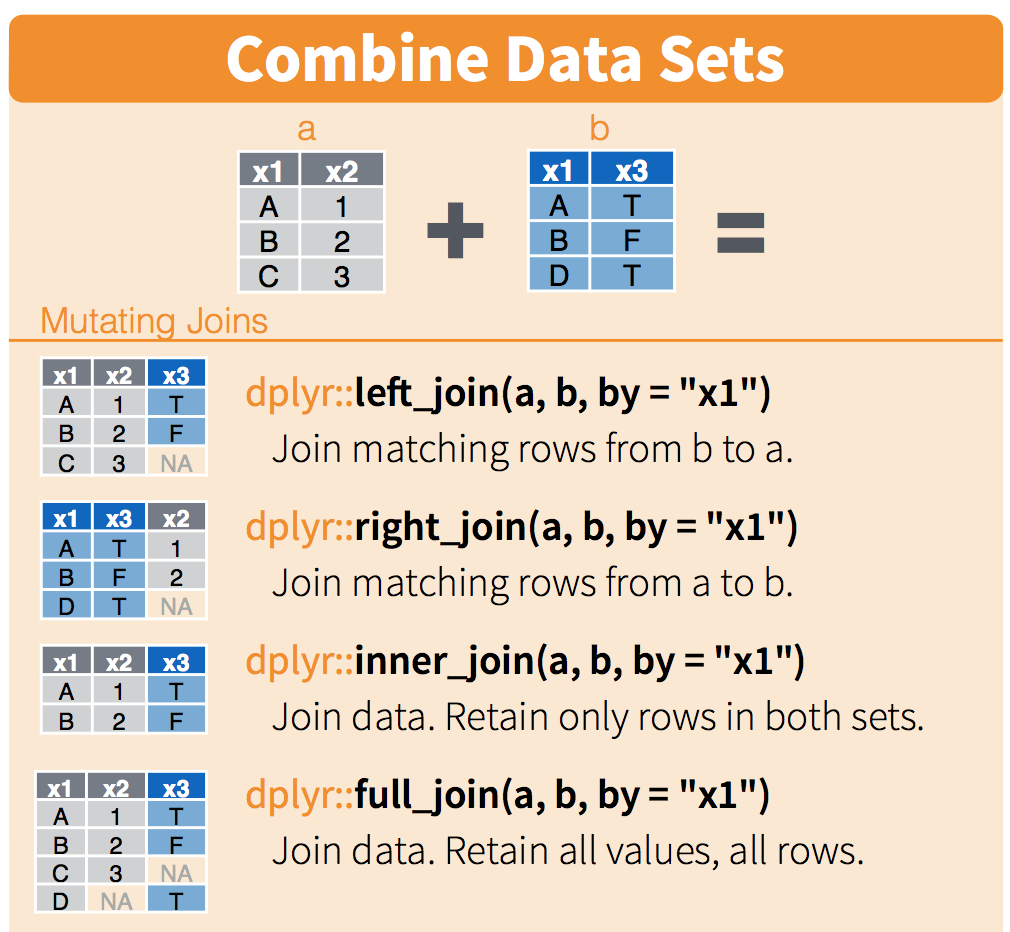
There are a number of ways to merge data frames in R. We’ll use full_join(), left_join(), and inner_join() in this session.
From R Documentation (?join):
full_join(): “returns all rows and all columns from both x and y. Where there are not matching values, returns NA for the one missing.” Basically, nothing gets thrown out, even if a match doesn’t exist - makingfull_join()the safest option for merging data frames. When in doubt,full_join().left_join(): “return all rows from x, and all columns from x and y. Rows in x with no match in y will have NA values in the new columns. If there are multiple matches between x and y, all combinations of the matches are returned.”inner_join(): “returns all rows from x where there are matching values in y, and all columns from x and y. If there are multiple matches between x and y, all combination of the matches are returned.” This will drop observations that don’t have a match between the merged data frames, which makes it a riskier merging option if you’re not sure what you’re trying to do.
Schematic (from RStudio data wrangling cheat sheet):
To clarify what the different joins are doing, let’s first make a subset of the fish_counts data frame that only contains observations from 2016 and 2017.
Take a look to ensure that only those years are included with View(fish_2016_2017). Now, let’s merge it with our kelp fronds data in different ways.
9.2.3.1 full_join() to merge data frames, keeping everything
When we join data frames in R, we need to tell R a couple of things (and it does the hard joining work for us):
- Which data frames we want to merge together
- Which variables to merge by
Note: If there are exactly matching column names in the data frames you’re merging, the *_join() functions will assume that you want to join by those columns. If there are no matching column names, you can specify which columns to join by manually. We’ll do both here.
# Join the fish_counts and kelp_counts_abur together:
abur_kelp_join <- fish_2016_2017 %>%
  full_join(kelp_counts_abur, by = c("year", "site")) # Uh oh. An error message.
When we try to do that join, we get an error message:
Error: Can't join on 'year' x 'year' because of incompatible types (character / numeric)
Let’s google this. That means copying this from the console and pasting it into Google.
What’s going on here? First, there’s something fishy (ha) going on with the class of the year variable in kelp_counts_abur. Use the class() function to see how R understands that variable (remember, we use $ to return a specific column from a data frame).
## [1] "character"So the variable is currently stored as a character. Why?
If we go back to the kelp_counts_curated.xlsx file, we’ll see that the numbers in both the year and month column have been stored as text. There are several hints Excel gives us:
- Cells are left aligned, when values stored as numbers are right aligned
- The green triangles in the corner indicate some formatting
- The warning sign shows up when you click on one of the values with text formatting, and lets you know that the cell has been stored as text. We are given the option to reformat as numeric in Excel, but we’ll do it here in R so we have a reproducible record of the change to the variable class.
There are a number of ways to do this in R. We’ll use mutate() to overwrite the existing year column while coercing it to class numeric using the as.numeric() function.
# Coerce the class of 'year' to numeric
kelp_counts_abur <- kelp_counts_abur %>%
  mutate(year = as.numeric(year))
Now if we check the class of the year variable in kelp_counts_abur, we’ll see that it has been coerced to ‘numeric’:
## [1] "numeric"Question: Isn’t it bad practice to overwrite variables, instead of just making a new one? Great question, and usually the answer is yes. Here, we feel fine with “overwriting” the year column because we’re not changing anything about what’s contained within the column, we’re only changing how R understands it. Always use caution if overwriting variables, and if in doubt, add one instead!
OK, so now the class of year in the data frames we’re joining is the same. Let’s try that full_join() again:
Let’s look at the merged data frame with View(abur_kelp_join). A few things to notice about how full_join() has worked:
- All columns that existed in both data frames still exist.
- All observations are retained, even if they don’t have a match. In this case, notice that for other sites (not ‘abur’) the observation for fish still exists, even though there was no corresponding kelp data to merge with it. The kelp frond data from 2018 is also returned, even though the fish counts dataset did not have ‘year == 2018’ in it.
- The kelp frond data is joined to all observations where the joining variables (year, site) are a match, which is why it is repeated 5 times for each year (once for each fish species).
Because all data (observations & columns) are retained, full_join() is the safest option if you’re unclear about how to merge data frames.
#### left_join() to merge data frames, keeping everything in the ‘x’ data frame and only matches from the ‘y’ data frame
Now, we want to keep all observations in fish_2016_2017, and merge them with kelp_counts_abur while only keeping observations from kelp_counts_abur that match an observation within fish_2016_2017. So when we use left_join(), any information on kelp counts from 2018 should be dropped.
## Joining, by = c("year", "site")Notice when you look at fish_kelp_2016_2017, the 2018 data that does exist in kelp_counts_abur does not get joined to the fish_2016_2017 data frame, because left_join(df_a, df_b) will only keep observations from df_b if they have a match in df_a!
9.2.3.2 inner_join() to merge data frames, only keeping observations with a match in both
When we used left_join(df_a, df_b), we kept all observations in df_a but only observations from df_b that matched an entry in df_a (in other words, some entries from df_b were excluded).
Use inner_join() if you know that you only want to retain observations when they match across both data frames. Caution: this is built to exclude any observations that don’t match across data frames by joined variables - double check to make sure this is actually what you want to do!
For example, if we use inner_join() to merge fish_counts and kelp_counts_abur, then we are asking R to only return observations where the joining variables (year and site) have matches in both data frames. Let’s see what the outcome is:
## Joining, by = c("year", "site")## # A tibble: 15 x 6
## year site common_name total_count month total_fronds
## <dbl> <chr> <chr> <dbl> <chr> <dbl>
## 1 2016 abur black surfperch 2 7 307
## 2 2016 abur blacksmith 1 7 307
## 3 2016 abur garibaldi 1 7 307
## 4 2016 abur rock wrasse 2 7 307
## 5 2016 abur senorita 58 7 307
## 6 2017 abur black surfperch 4 7 604
## 7 2017 abur blacksmith 1 7 604
## 8 2017 abur garibaldi 1 7 604
## 9 2017 abur rock wrasse 57 7 604
## 10 2017 abur senorita 64 7 604
## 11 2018 abur black surfperch 1 7 3532
## 12 2018 abur blacksmith 1 7 3532
## 13 2018 abur garibaldi 1 7 3532
## 14 2018 abur rock wrasse 1 7 3532
## 15 2018 abur senorita 1 7 3532Here, we see that only observations where there is a match for year and site in both data frames are returned.
9.2.3.3 *_join() in a sequence
We can also merge data frames as part of a sequence of wrangling steps.
As an example: Starting with the invert_counts data frame, we want to:
- First, use
pivot_longer()to get year and counts each into a single column - Convert the class of year to numeric (so it can join with another numeric year variable)
- Then, only keep observations for “california spiny lobster”
- Next, join the
kelp_counts_aburto the resulting subset above, only keeping observations that have a match in both data frames
That might look like this:
abur_lobster_kelp <- invert_counts %>%
  pivot_longer('2016':'2018', names_to = "year", values_to = "total_counts") %>%
  mutate(year = as.numeric(year)) %>%
  filter(common_name == "california spiny lobster") %>%
  inner_join(kelp_counts_abur)
## Joining, by = c("month", "site", "year")## # A tibble: 3 x 6
## month site common_name year total_counts total_fronds
## <chr> <chr> <chr> <dbl> <dbl> <dbl>
## 1 7 abur california spiny lobster 2016 17 307
## 2 7 abur california spiny lobster 2017 17 604
## 3 7 abur california spiny lobster 2018 16 35329.2.3.3.1 Activity
Now let’s combine what we’ve learned about piping, filtering and joining!
Task: Complete the following as part of a single sequence (remember, check to see what you’ve produced after each step) to create a new data frame called my_fish_join:
- Start with
fish_countsdata frame - Filter to only including observations for 2017 at Arroyo Burro
- Join the
kelp_counts_aburdata frame to the resulting subset usingleft_join() - Add a new column that contains the ‘fish per kelp fronds’ density (total_count / total_fronds)
Solution:
Sync your project with your repo on GitHub.
9.3 Fun / kind of scary facts
How is this similar to VLOOKUP in Excel? How does it differ?
From Microsoft Office Support, “use VLOOKUP when you need to find things in a table or a range by row.”
So, both filter() and VLOOKUP look through your data frame (or spreadsheet, in Excel) to look for observations that match your conditions. But they also differ in important ways:
By default
VLOOKUPlooks for and returns an observation for approximate matches (and you have to change the final argument to FALSE to look for an exact match). In contrast, by defaultfilter()will look for exact conditional matches.VLOOKUPwill look for and return information from the first observation that matches (or approximately matches) a condition.filter()will return all observations (rows) that exactly match a condition.
9.4 Interludes (deep thoughts/openscapes)
Not overusing the pipe in really long sequences. What are other options? Why is that a concern? What are some ways to always know that what’s happening in a sequence is what you EXPECT is happening in a sequence? tidylog, check intermediate data frames, sometimes write intermediate data frames, etc.
The risk of partial joins (& a case for full_join + drop_na instead?)
9.5 Efficiency Tips
- Comment out multiline code with Command + Shift + C
- Knit with Command + Shift + K